Hidden Away in a Barely-Viewed Video is the Map of Europe Which the EPO Hides, as It Demonstrates Decline in Applications That EPO Cannot Deny
- Dr. Roy Schestowitz
- 2017-03-17 15:07:46 UTC
- Modified: 2017-03-17 15:07:46 UTC
Summary: The facts that the EPO has been trying to conceal make it abundantly apparent that the Office is having a crisis and stakeholders too are seeing it (and gradually respond accordingly, by divesting)
"D
emand for patent protection in Europe remains high in 2016," the EPO
said this afternoon. We wrote several rebuttals to these 'results', including:
We also wrote three articles about the offensive maps from the EPO, namely:
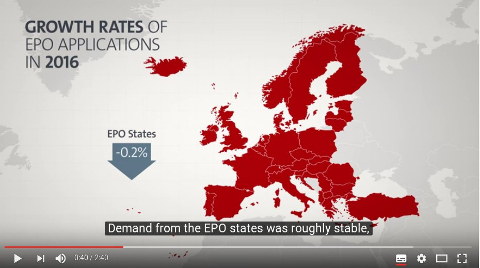
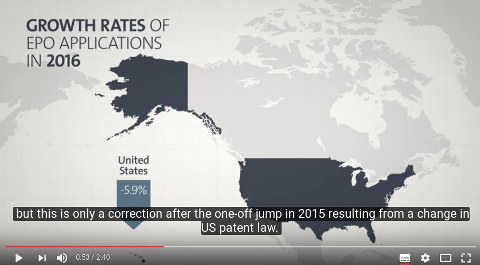
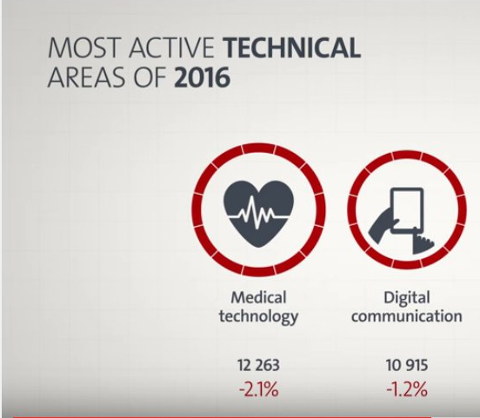
That last one was published this morning. Since then, the EPO has made the above tweet available, linking to a video with the following frames (and transcript shown with an overlay). Let's look, shall we?

With the EPO's voiceover added to make up excuses, calling declines "roughly stable" (and the bold text "GROWTH RATES" at the top, alluding to declines)

More excuses. With grants up 40% (supply surge while demand decreases)? Why are minuses symbolised by blue and not red in the maps (almost the same colour as US states)?

No comment is necessary (but finally they've found the red colour)
In the next post we'll tackle the insidious video of Battistelli, the undisputed Liar in Chief. We'd be truly flabbergasted if we did not already know Battistelli's nature.
⬆


